

Ever wondered what actually happens when you click “Login,” refresh Instagram, or order food on Swiggy?
You click a button.
A loading spinner appears.
Then suddenly — data shows up.
Simple, right?
Not really.
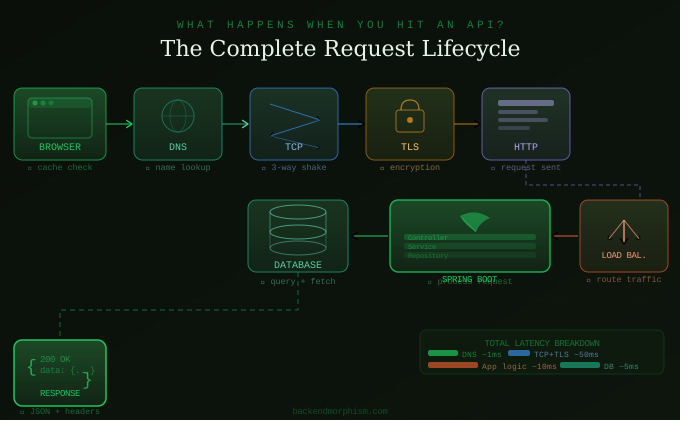
Behind that one click, your request travels through multiple systems in milliseconds — browser, DNS, TCP connection, HTTPS encryption, CDN, load balancer, API gateway, backend server, cache, and database.
And if even one piece fails, your API suddenly returns:500 Internal Server Error
or worse: 504 Gateway Timeout
If you’re learning backend engineering, preparing for Java interviews, or building production systems with Spring Boot — understanding this flow changes how you think, debug, and design.
Let’s break it down step by step.
Table of Contents
ToggleThe Full Picture First
Before diving in, here’s the entire journey your request takes:
Browser
   ↓
DNS Resolution
   ↓
TCP Connection
   ↓
TLS/HTTPS Handshake
   ↓
CDN / Firewall
   ↓
Load Balancer
   ↓
API Gateway
   ↓
Backend Application (Spring Boot)
   ↓
Redis Cache
   ↓
Database
   ↓
Response travels back
   ↓
Browser renders result
This entire journey? Usually 100–300ms.
Sometimes less.
Now let’s understand each step.
Step 1: Browser Builds the HTTP Request
Everything starts in the browser.
You click a button. JavaScript fires: fetch("/api/orders")
The browser creates an HTTP request — a structured message that tells the server what you want.
It looks like this:
GET /api/orders HTTP/1.1
Host: backendmorphism.com
Authorization: Bearer xyz123
Accept: application/json
User-Agent: Chrome/120
Three things go into every request:
Method — What action to perform:
GET→ fetch dataPOST→ create somethingPUT→ updateDELETE→ remove
Headers — Extra context (auth token, content type, language preference):
Authorization: Bearer token
Content-Type: application/json
Body — Only for POST/PUT. The actual data being sent:
{
  "email": "user@gmail.com",
  "password": "secret"
}
At this point, the browser knows what it wants to send.
But it doesn’t yet know where to send it.
It only has a domain name: backendmorphism.com
That’s where DNS comes in.
Step 2: DNS Resolution — Translating the Address
The internet doesn’t understand domain names.
It understands IP addresses — like 104.21.33.77.
DNS is the phonebook that converts one to the other.
Your browser checks multiple places in sequence:
Browser Cache
   ↓
OS Cache
   ↓
Router Cache
   ↓
ISP DNS Server
   ↓
Root Name Server
   ↓
TLD Server (.com)
   ↓
Authoritative DNS
   ↓
Returns: 104.21.33.77
On a warm cache — this takes under 1ms.
On a cold lookup — up to 120ms.
Production Insight 🔍
DNS failure is one of the most misdiagnosed production issues.
You see
DNS_PROBE_FINISHED_NXDOMAINand immediately think: “Backend is down.”But your backend could be perfectly healthy.
Always check DNS first before blaming application code. In Kubernetes, this becomes even more critical — pods get new IPs on restart, and Java’s JVM caches DNS results forever by default. Set
-Djava.networkaddress.cache.ttl=30in production to avoid routing to dead pods.
Step 3: TCP Connection — Opening the Line
Now the browser knows the IP.
Before sending your actual request, both sides need to agree to talk.
This is the TCP 3-Way Handshake:
Client → SYN       ("Can we talk?")
Server → SYN-ACK   ("Yes, I'm here.")
Client → ACK       ("Great, let's go.")
Only after this handshake does real data transfer begin.
Takes roughly 10–50ms depending on how far away the server is.
Interview Question 🎯
“Why TCP and not UDP for APIs?”
APIs require reliability — your order must reach the server in full and in order. TCP guarantees this with sequence numbers and retransmission.
UDP is faster but has no guarantees. You use UDP where speed matters more than reliability: video calls, live scores, gaming.
Step 4: TLS Handshake — Securing the Connection
If the URL starts with https:// — which it always should in production — a TLS handshake happens on top of TCP.
Without it, anyone on public WiFi can read:
{
  "username": "admin",
  "password": "123456"
}
TLS prevents this by encrypting everything in transit.
The handshake process:
Client says hello (shares supported TLS version + ciphers)
   ↓
Server shares its SSL certificate
   ↓
Browser verifies certificate with trusted CA
   ↓
Both sides generate shared encryption keys
   ↓
Encrypted communication begins 🔒
This is why your browser shows a padlock in the URL bar.
Real Production Issue 🚨
SSL certificates expire — and when they do, your entire app goes down even if the backend and database are perfectly healthy.
Error:
NET::ERR_CERT_DATE_INVALIDThis happens in production more than anyone admits. Use AWS Certificate Manager or Let’s Encrypt with auto-renewal. Never manage certificate expiry manually.
Step 5 → 7: CDN, Load Balancer, API Gateway
These three layers sit between the internet and your application. Most beginners skip them. Interviewers don’t.
Think of them as a sequence:
CDN handles what it can. What it can’t, the load balancer distributes. The gateway on each server decides what runs it.
CDN (Content Delivery Network)
Cloudflare, Akamai, AWS CloudFront — these cache your responses close to the user.
If your API returns data that doesn’t change often (product catalogue, public config), the CDN can return it directly.
Your backend never gets involved.
Huge performance gain.
CDN also blocks DDoS attacks and filters malicious traffic via WAF (Web Application Firewall) — catching SQL injections like:
OR 1=1 --before they ever touch your code.
Real Engineering Insight 💡
Developers often say: “API isn’t hitting backend.”
Reality: Cloudflare blocked it. Always check CDN logs and WAF rules before blaming backend code.
Load Balancer
With 10 lakh users hitting your API simultaneously, one server dies.
Load balancers distribute traffic across multiple instances:
User Request
      ↓
 Load Balancer
  ↙    ↓    ↘
App1  App2  App3
Nginx, AWS ELB, HAProxy — all do this job.
They also run health checks — if App2 crashes, traffic automatically goes to App1 and App3.
API Gateway
The final traffic controller before your code runs.
Handles:
- Authentication checks
- Rate limiting
- Request routing by path (
/api/user→ User Service,/api/payment→ Payment Service) - Logging and metrics
Popular options: Kong, AWS API Gateway, Apigee.
Step 8: Backend Application Logic
Finally — your code runs.
Here’s what happens inside a Spring Boot application:
HTTP request arrives at embedded Tomcat
          ↓
Filter Chain (JWT validation, CORS, rate limiting)
          ↓
DispatcherServlet matches the request to a controller
          ↓
Your @RestController method is called
          ↓
@Service handles business logic
          ↓
@Repository queries the database
          ↓
Result flows back up
          ↓
Jackson serializes it to JSON
          ↓
HTTP Response sent
What this looks like in code:
@RestController
@RequestMapping("/users")
public class UserController {

    @Autowired
    private UserService userService;

    @GetMapping("/{id}")
    public ResponseEntity<UserDTO> getUser(
            @PathVariable Long id) {
        UserDTO user = userService.findById(id);
        return ResponseEntity.ok(user);
    }
}
@Service
public class UserService {
@Autowired
private UserRepository userRepository;
public UserDTO findById(Long id) {
User user = userRepository
.findById(id)
.orElseThrow(() ->
new UserNotFoundException(id));
return UserMapper.toDTO(user);
}
}🔧 Backend Engineering Depth
Before
getUser()ever runs, Spring processes the request through a Filter Chain: JWT token validation, CORS headers, logging, rate limit checks. If your JWT is expired, the request is rejected here — your controller code never executes.This is also why
@Transactionalsometimes doesn’t behave as expected — it works through Spring’s proxy mechanism, which only activates when the method is called through the Spring context, not internally. If you’re calling a@Transactionalmethod from within the same class, the transaction silently doesn’t apply.And one rule: never return JPA
@Entityobjects directly from your API. Map to DTOs. Returning entities exposes your database schema, creates circular reference issues with Hibernate proxies, and leaks sensitive fields.
Step 9: Cache Check — Redis First
Smart backends don’t hit the database for every request.
They check Redis first:
Request comes in
      ↓
Check Redis cache
      ↓
Cache hit? → Return immediately (5ms)
      ↓
Cache miss? → Query database (50-200ms)
      ↓
Store result in Redis for next time
The speed difference is significant:
Redis hit   → ~5ms
DB query    → ~50–200ms
DB (no index) → 500ms–5s+
Real example: Think of IPL ticket booking.
Millions hitting GET /seat-availability simultaneously.
Without Redis — database crashes within seconds.
With Redis — system survives because 99% of requests never touch the database.
🔧 Backend Engineering Depth
The pattern above is called Cache-Aside (also called Lazy Loading) — the most common caching pattern in Spring Boot.
But it has a hidden problem: cache stampede.
If 10,000 requests arrive at the exact moment a popular cache key expires, all 10,000 go to the database simultaneously. The database gets crushed.
Solutions: probabilistic early expiration, distributed locks on cache miss, or using Spring’s
@Cacheablewith sensible TTLs. This comes up in senior-level interviews.
Step 10: Database Query
Cache miss means a real database query.
SELECT * FROM users WHERE id = 101;Database returns a row.
Backend maps it to a Java object.
Jackson converts it to JSON:
{
  "id": 101,
  "name": "Rahul",
  "email": "rahul@gmail.com"
}
🔧 Backend Engineering Depth
Before your query even reaches the database, Spring Boot borrows a connection from HikariCP — the default connection pool. Opening a fresh DB connection per request costs ~50–100ms. HikariCP maintains pre-established connections so this cost is near zero.
But here’s the production trap: during a traffic spike, if queries get slow, threads wait for DB responses. The HikariCP pool saturates. New requests queue up. Tomcat’s thread pool fills. Application stops responding entirely.
Monitor
hikaricp.connections.pendingin Spring Boot Actuator. When this number spikes, you’re heading toward an outage.The other common bottleneck — missing indexes. A
SELECTon 5 crore rows without an index causes a full table scan:-- This without an index on status = disaster SELECT * FROM orders WHERE status = 'SUCCESS';Always run
EXPLAIN ANALYZEon slow queries and watch for sequential scans.
Step 11: Response Travels Back
Data retrieved. Now it flows back the same path in reverse:
Database → Backend → API Gateway
→ Load Balancer → CDN → Browser
Browser receives the HTTP response:
{
  "status": "SUCCESS",
  "data": { ... }
}
HTTP status codes tell the story:
200 OK              → success
201 Created         → new resource created
400 Bad Request     → client sent invalid data
401 Unauthorized    → no valid auth token
403 Forbidden       → authenticated but no access
404 Not Found       → resource doesn't exist
500 Internal Error  → something broke on server
503 Unavailable     → server temporarily down
504 Gateway Timeout → backend took too long
How to Watch This in Real Time
Open Chrome DevTools (F12) → Network Tab.
Every API call shows you:
- Request URL and method
- Headers sent and received
- Request payload
- Response body
- Status code
- Timing breakdown — DNS, TCP, TLS, waiting, download
The Timing tab alone will show you exactly which step is slow.
This is one of the most underrated debugging tools for backend engineers.
The Interview Answer That Gets You Hired
Interviewers at good companies don’t ask “What is REST API?”
They ask:
“Walk me through what happens internally when a client hits an API.”
Because it tests networking fundamentals, backend understanding, system design thinking, and debugging mindset — all in one question.
Here’s the answer framework that makes you stand out:
1. Browser builds HTTP request (method, headers, body)
2. DNS resolves domain → IP address
3. TCP 3-way handshake opens the connection
4. TLS handshake encrypts it (for HTTPS)
5. CDN handles or passes through, WAF filters threats
6. Load balancer routes to a healthy server instance
7. API Gateway authenticates, rate-limits, routes
8. Backend: Filter Chain → Controller → Service → Repository
9. Redis cache checked first (cache-aside pattern)
10. DB queried on cache miss (HikariCP pool, indexed queries)
11. JSON response serialized by Jackson
12. Response travels back through the same layers
Then add one production detail: “In Spring Boot, before the controller runs, the Filter Chain handles authentication. A missing or expired JWT gets rejected here — the business logic never executes.”
That one sentence separates you from 90% of candidates.
Production Debugging Mindset
API slow or broken? Don’t blindly blame backend code.
Diagnose layer by layer:
DNS issue?          → nslookup yourdomain.com
SSL expired?        → check certificate validity
CDN blocking?       → check Cloudflare/WAF logs
Load balancer?      → check health check status
DB slow?            → EXPLAIN ANALYZE on queries
HikariCP exhausted? → check pool pending metric
Redis down?         → check cache connection
Thread blocked?     → take a thread dump
Good engineers debug systematically. Not by guessing.
Common Myths Beginners Believe
“API directly hits the database” Wrong. There are always layers — gateway, auth, service, cache — before any DB query.
“Frontend calls backend directly” Sometimes. But in production: CDN, WAF, load balancer, and API gateway usually sit in between.
“500 error means a backend bug” Not always. Could be DB unavailable, a failing dependency, a timeout, or OOM. Check logs and metrics before assuming.
“HTTPS is just HTTP with a padlock” HTTPS changes performance characteristics (TLS handshake adds latency), changes debugging approaches (encrypted traffic), and is non-negotiable for any authenticated API.
Key Takeaways
✅ An API call triggers 10+ systems before your controller code runs
✅ DNS, TCP, and TLS together add 50–200ms before your code is involved
✅ CDN → Load Balancer → API Gateway — each has a distinct job
✅ Spring Boot processes: Tomcat → Filter Chain → DispatcherServlet → Controller → Service → Repository
✅ Always check Redis cache before touching the database
✅ HikariCP pool exhaustion is the #1 cause of Spring Boot application outages under load. These HikariCP and Spring Boot internals are covered in depth in our Java Backend Interview Kit
✅ Missing DB indexes kill APIs silently — use EXPLAIN ANALYZE
✅ Chrome DevTools Network tab shows you exactly which layer is slow
✅ Debugging means checking each layer in order — not guessing
Frequently Asked Questions
Does the browser directly call the database?
No. Browser calls the backend API. Backend interacts with the database. There are always multiple layers in between.
Why does HTTPS matter for APIs?
It encrypts data in transit. Without it, credentials, tokens, and sensitive data can be intercepted by anyone on the same network. It also prevents tampering with responses.
Why Redis instead of just the database?
Database queries typically take 50–200ms. Redis responds in 1–5ms. For read-heavy endpoints that return the same data to many users, caching reduces database load dramatically and keeps response times low under traffic spikes.
What causes a 504 Gateway Timeout?
The load balancer or gateway waited too long for a response from the backend. Usually caused by a slow database query, a blocked thread, a slow external API call, or HikariCP connection pool exhaustion.
How can I see exactly what my API sends and receives?
Open Chrome DevTools (F12) → Network tab. Click any request. You’ll see headers, payload, response, status code, and a full timing breakdown showing DNS, TCP, TLS, and server processing time separately.
What’s the difference between 401 and 403?
401 Unauthorized — you have no valid credentials (not logged in, token missing or expired). 403 Forbidden — you are authenticated but don’t have permission for that resource.
Want to Master These Topics for Interviews?
Every concept in this blog — Spring Boot internals, HTTP, JVM, HikariCP, caching, system design — comes up in backend interviews.
The BackendMorphism Java Backend Interview Kit covers all of it with real production context:
→ Spring Boot and Hibernate deep dives → System design patterns → SQL optimization and query internals → 200+ interview questions with detailed answers → Microservices, messaging, and API design
Built for Java backend engineers targeting mid to senior roles.
[Download the Java Backend Interview Kit →]
